Reports and Analytics
Reports and Analytics is the management visibility layer of the platform. It does not replace the source modules; it summarizes their records so administrators, risk owners, control owners, auditors, and executives can understand program health and decide what needs action.
Use this module to answer four questions:
- Are compliance obligations being assessed and remediated?
- Are high and critical risks increasing or decreasing?
- Are findings, issues, exceptions, and reviews overdue?
- Are the program KPIs inside the agreed tolerance?
1. Background and Business Purpose
GRC data is created across many modules: assessments, controls, risks, policies, audits, issues, vendors, assets, incidents, and awareness. Reports convert that operational detail into management views.
Administrators should use Reports and Analytics for:
- monthly GRC committee packs
- executive risk and compliance updates
- audit preparation and evidence follow-up
- owner performance monitoring
- overdue action escalation
- board-level KPI and trend reporting
- recurring stakeholder reports
The most important rule is data ownership: if a report number looks wrong, correct the source record in the related module instead of treating the report as a separate data entry area.
2. Page Structure
| Page / View | What It Shows | Typical User |
|---|---|---|
| Dashboard | Current compliance, active assessments, risks, overdue issues, pending approvals, alerts, and assigned tasks. | Executives, GRC managers, administrators. |
| Reports | Compliance, framework, risk, audit, assessment, and self-assessment outputs. | GRC managers, auditors, compliance owners. |
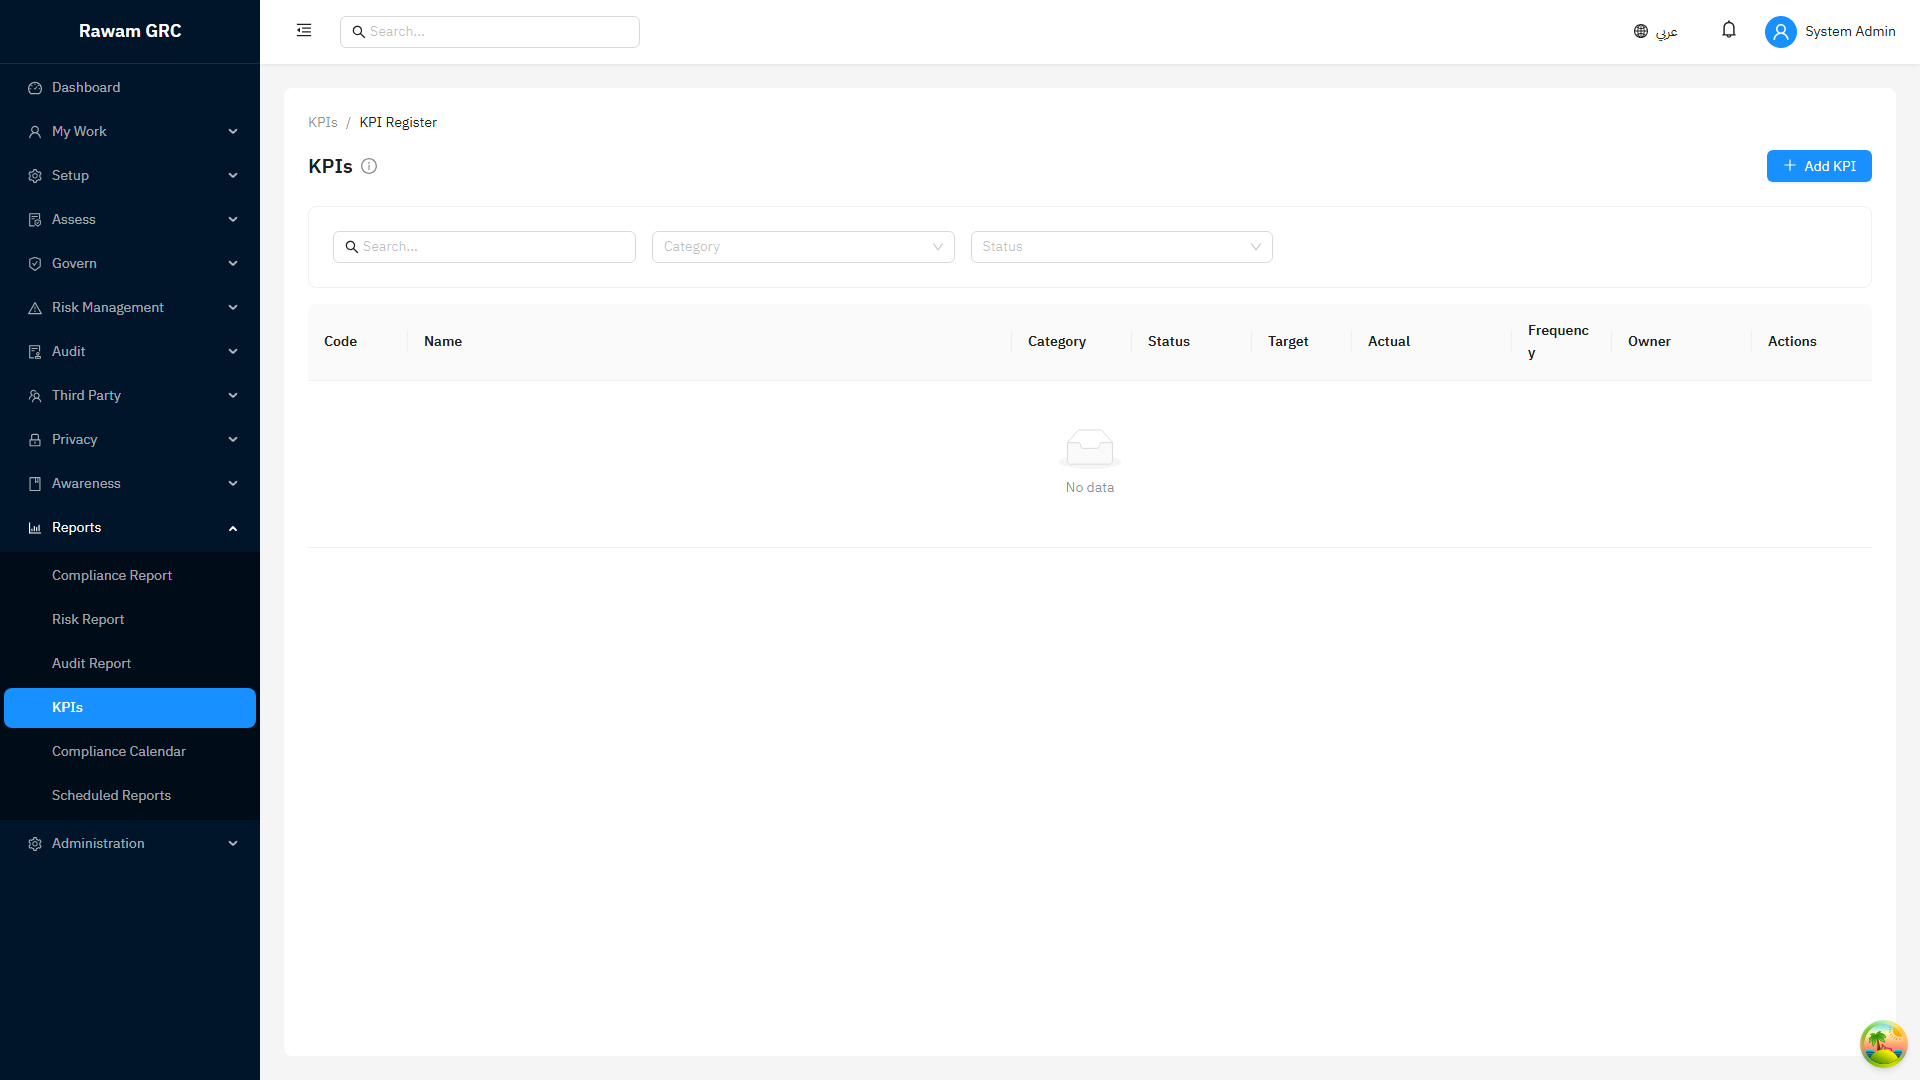
| KPIs & Metrics | KPI definitions, current values, thresholds, trends, and status. | GRC managers, KPI owners, administrators. |
| Scheduled Reports | Recurring report delivery setup, frequency, recipients, format, and status. | Administrators and report owners. |
| Exports | PDF or Excel outputs for review meetings, evidence packs, and offline analysis. | Module owners, auditors, management. |
3. Recommended Workflow
- Open Dashboard first to identify urgent items.
- Review alerts, overdue issues, pending approvals, critical risks, and active assessments.
- Open Reports when you need a formal output for a specific topic.
- Apply filters such as framework, assessment, owner, date range, status, severity, or department.
- Validate the summary cards before exporting.
- Drill into source modules when a number needs explanation.
- Create or update issues/actions for follow-up.
- Use Scheduled Reports only for recurring reports with a clear owner and audience.
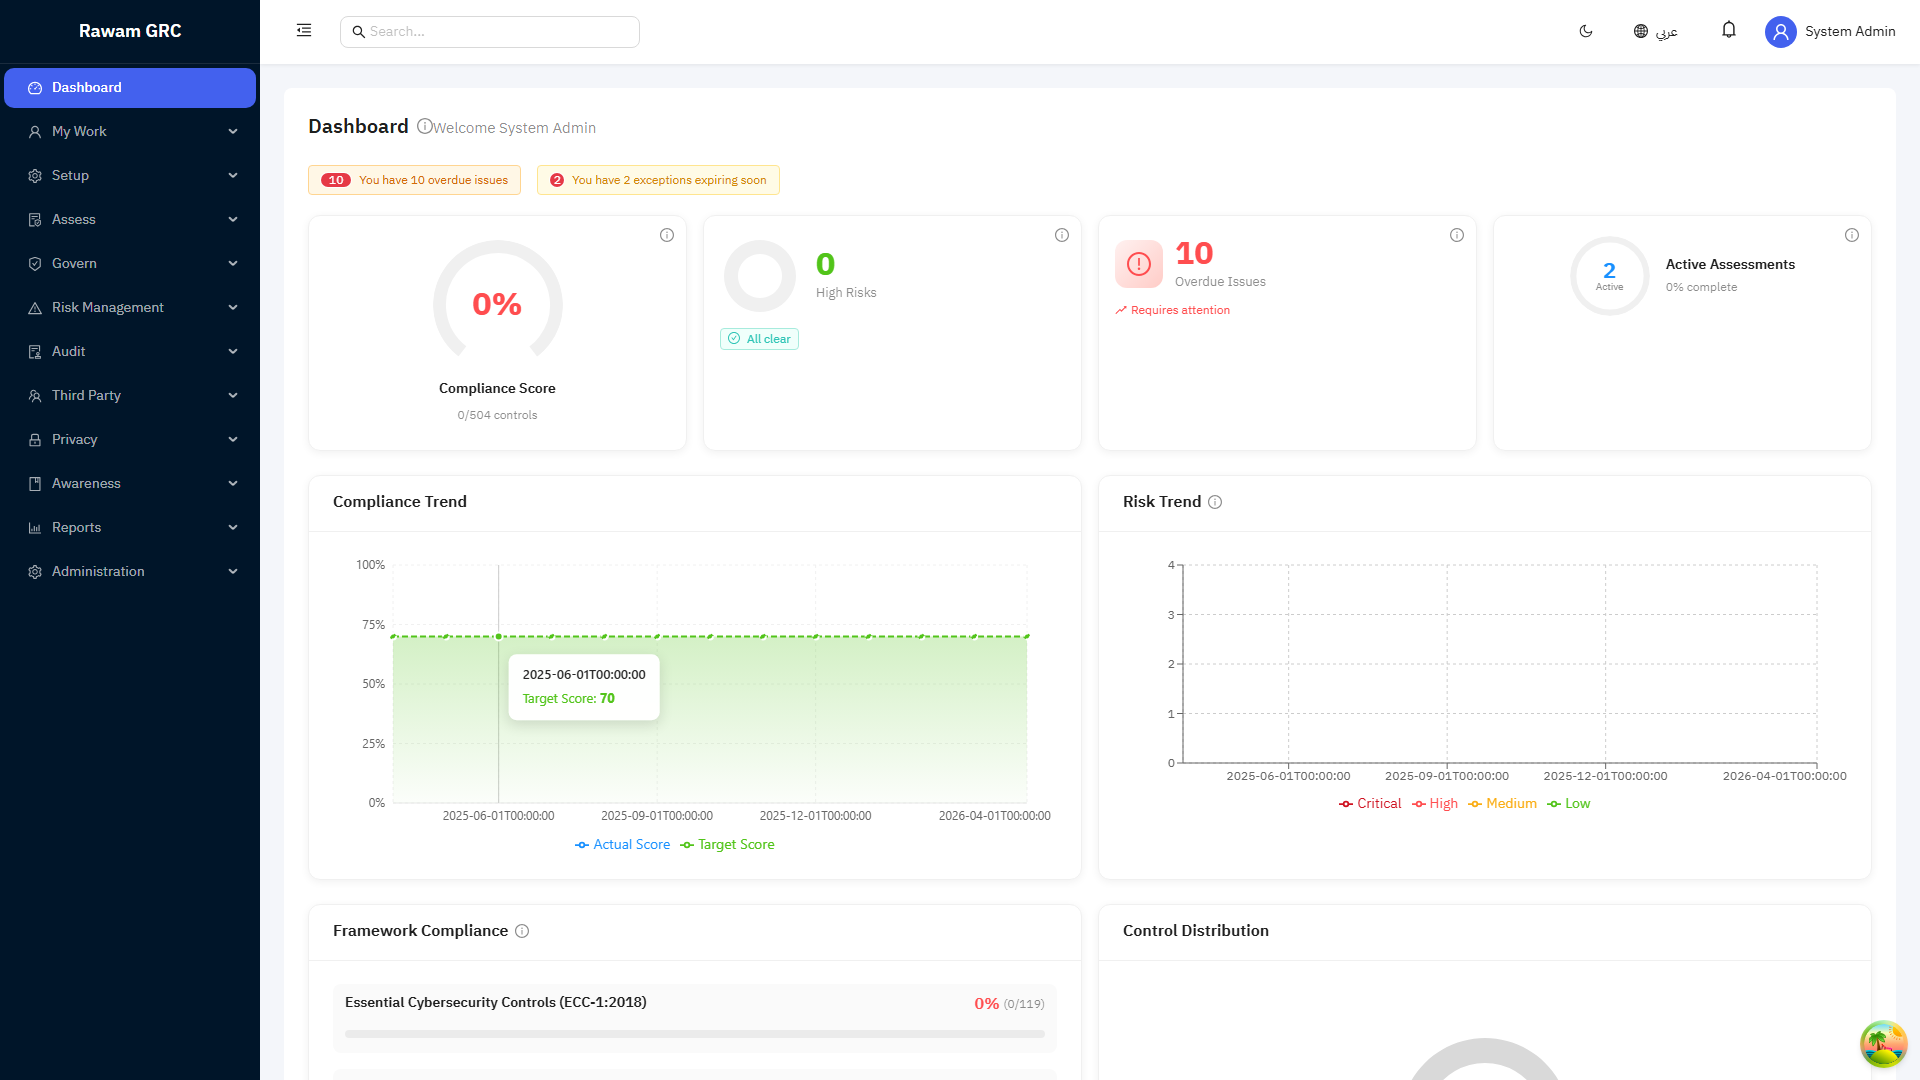
4. Dashboard Interpretation
The dashboard is designed for attention management. It highlights what is active, overdue, pending approval, or outside tolerance.
| Widget | Meaning | How to Interpret |
|---|---|---|
| Compliance Score | Percentage of controls currently marked compliant compared with total controls. | A low score means compliance evidence or implementation is incomplete. Check assessments and control statuses. |
| Compliance Delta | Change compared with the previous period selected in the dashboard. | Positive movement usually means more controls became compliant; negative movement means compliance decreased or new obligations were added. |
| Active Assessments | Assessments currently in progress. | High count may be normal during a campaign; overdue or stalled assessments need owner follow-up. |
| Open Findings | Audit findings not closed. | Use severity and due date to prioritize remediation. |
| High Risks | Open risks with residual score from 12 to 15. | These require active monitoring and treatment tracking. |
| Critical Risks | Open risks with residual score 16 or higher. | These require immediate management attention and appetite review. |
| Overdue Issues | Issues past due date and not closed or resolved. | Escalate to assigned owners and review blockers. |
| Pending Approvals | Assessments, policies, or exceptions waiting for review or approval. | Follow approval queues to prevent workflow bottlenecks. |
| My Tasks | Assigned open issues ordered by due date. | Work oldest or highest priority items first. |
| Alerts | Overdue issues, critical risks, and exceptions expiring soon. | Treat alerts as the daily admin triage list. |
Dashboard Periods
The dashboard compares the current period with the equivalent previous period:
| Period | Current Window | Previous Window |
|---|---|---|
| Week | Last 7 days | The 7 days before that. |
| Month | Last month | The month before that. |
| Quarter | Last 3 months | The 3 months before that. |
| Year | Last 12 months | The 12 months before that. |
5. Dashboard Calculation Rules
These rules explain what the main numbers mean from an administrator perspective.
| Metric | Calculation |
|---|---|
| Compliance Score | Distinct compliant controls divided by total controls, multiplied by 100. |
| Previous Compliance Score | Compliant controls from assessments completed in the previous comparison period, divided by total controls. |
| Compliance Delta | Current compliance score minus previous compliance score. |
| Active Assessments | Assessments with status In Progress. |
| Open Findings | Audit findings where status is not Closed. |
| High Risks | Open risks where residual likelihood x residual impact is 12 to 15. |
| Critical Risks | Open risks where residual likelihood x residual impact is 16 or higher. |
| Overdue Issues | Issues with due date in the past and status not Closed or Resolved. |
| Pending Approvals | Assessments pending review, policies pending approval, and policy exceptions pending approval. |
| Active Exceptions | Policy exceptions with status Approved. |
| Expiring Exceptions | Approved policy exceptions expiring within 30 days. |
| High-Risk Vendors | Active vendors with high or critical residual risk rating. |
| Critical Assets | Assets marked as critical. |
Risk score thresholds here use residual risk, not inherent risk. If a risk appears lower than expected, check whether treatment controls or residual values were updated.
6. Report Types
| Report Type | Purpose | Important Filters | Source Modules |
|---|---|---|---|
| Compliance Summary | Shows overall compliance posture across frameworks and controls. | Framework, date range, status, owner. | Compliance, Assessments, Controls. |
| Framework Compliance | Shows compliance for one selected framework. | Framework is required. | Frameworks, domains, controls, assessments. |
| Assessment Report | Shows one assessment with control responses, evidence, status, and results. | Assessment is required. | Assessments, controls, evidence, findings. |
| Risk Register | Shows open risks, ratings, owners, treatment status, and review signals. | Status, owner, category, severity, date range. | Risk Management, assets, vendors, controls. |
| Audit Summary | Shows audit findings, severity, due dates, and remediation status. | Audit, severity, status, owner, due date. | Audit, findings, issues. |
| Self-Assessment Report | Produces a structured self-assessment output when applicable. | Assessment scope and selected framework. | Assessments and framework controls. |
7. KPI and Metrics Workflow
- Open KPIs & Metrics.
- Review KPI cards by category: Risk, Compliance, Security, and Operational.
- Check the current value, target, threshold status, and latest measurement date.
- Investigate any KPI marked At Risk or Critical.
- Open the source module to understand which records caused the KPI value.
- Assign an issue or remediation task when the KPI requires action.
- Review thresholds periodically to confirm they still match management appetite.
KPI Status Logic
Each KPI has a green threshold and yellow threshold.
| KPI Direction | Green | At Risk | Critical |
|---|---|---|---|
| Lower value is better | Value is less than or equal to green threshold. | Value is above green but less than or equal to yellow threshold. | Value is above yellow threshold. |
| Higher value is better | Value is greater than or equal to green threshold. | Value is below green but greater than or equal to yellow threshold. | Value is below yellow threshold. |
Examples:
- For Open Critical Risks, lower is better. A smaller number means the program is healthier.
- For Control Test Coverage, higher is better. A larger percentage means more controls were tested recently.
8. Default KPI Formulas
The platform includes default KPIs that administrators can use as a baseline. Values are recalculated from source module records.
| KPI | Formula | Default Target | Green | Yellow |
|---|---|---|---|---|
| Open Risks | Count of risks that are not deleted and not closed or accepted. | 20 | 10 | 20 |
| Critical Risks | Count of open risks where residual likelihood x residual impact is 16 or higher. | 5 | 2 | 5 |
| Overdue Audit Findings | Count of open audit findings with due date in the past. | 5 | 2 | 5 |
| Control Test Coverage | Distinct controls tested in the last 90 days divided by total active controls, multiplied by 100. | 80% | 80% | 60% |
| Policy Acknowledgement Rate | Acknowledgements for published policies divided by published policies x active users, multiplied by 100. | 90% | 90% | 70% |
| Open Incidents | Count of incidents where status is not closed. | 10 | 5 | 10 |
| Open Critical Vulnerabilities | Count of open vulnerabilities with critical severity. | 3 | 1 | 3 |
| Overdue Issues | Count of issues past due date and not closed or resolved. | 10 | 5 | 10 |
| High-Risk Vendors | Count of active vendors with high or critical criticality. | 10 | 5 | 10 |
| Assessment Compliance Rate | Compliant assessed controls divided by all assessed controls, multiplied by 100. | 85% | 85% | 65% |
Important interpretation notes:
- Policy acknowledgement uses published policies and active users as the denominator. If a policy is targeted to a smaller group, the top-level KPI may look lower than a targeted campaign report.
- Assessment compliance only counts assessed controls. Controls still marked Not Assessed are not part of that KPI percentage.
- Critical risk KPIs use residual scoring. Update residual likelihood and impact after treatment decisions.
- Control test coverage looks at the last 90 days. Older test evidence may still be useful, but it does not improve this KPI.
9. Scheduled Reports
Scheduled Reports are used when stakeholders need automatic delivery.
Supported schedule patterns:
| Frequency | Required Setup |
|---|---|
| Daily | Time and recipients. |
| Weekly | Day of week, time, and recipients. |
| Monthly | Day of month, time, and recipients. |
| Quarterly | Day of month, time, and recipients. |
Supported output formats are PDF and Excel.
When creating a scheduled report:
- Enter a clear report name.
- Select report type.
- Add a short description explaining the audience and purpose.
- Select schedule frequency.
- Set the delivery day and time.
- Choose PDF or Excel.
- Add recipient email addresses.
- Apply filters such as framework, assessment, status, or date range.
- Save and verify that the first delivery is expected.
Do not schedule reports without an owner. If nobody reviews the report, it becomes noise and weakens governance discipline.
10. Actions and Administrator Controls
| Action | When to Use It | Admin Guidance |
|---|---|---|
| Filter | Before interpreting or exporting a report. | Always confirm the scope before sharing numbers externally. |
| Export | For committee packs, evidence packs, audit requests, or offline analysis. | Export after checking the source data quality. |
| Schedule | For recurring reports with stable audience and purpose. | Review recipients and filters periodically. |
| Drill Down | When a number needs explanation. | Open the source module and inspect the records behind the metric. |
| Create Follow-Up | When a report shows overdue or high-risk items. | Create an issue, assign an owner, and set a due date. |
| Recalculate KPI | When source records changed and the KPI should reflect the latest state. | Validate the source records before recalculation. |
11. Cross-Module Dependencies
Reports and KPIs depend on the accuracy of source modules.
| Source Module | How It Affects Reports |
|---|---|
| Compliance and Assessments | Controls, control status, assessment progress, evidence, findings, and compliance score. |
| Risk Management | Inherent and residual scores, treatment status, owners, appetite breaches, reviews, and linked assets/vendors. |
| Policies | Published policies, approvals, acknowledgements, exceptions, review dates, and expiry dates. |
| Audit | Audit findings, due dates, severity, status, and remediation progress. |
| Issues | Overdue issues, owner workload, remediation tracking, and dashboard alerts. |
| Assets | Critical assets and risk context. |
| Vendors | High-risk vendors and third-party exposure. |
| Security | Open incidents and critical vulnerabilities. |
| Awareness | Training completion and survey participation when those reports are enabled. |
Cross-feature examples:
- A non-compliant assessment control can reduce compliance score and may create or justify a related risk, issue, or finding.
- A critical residual risk appears in dashboard risk counts and KPI values until it is closed, accepted, or its residual score changes.
- An approved policy exception affects exception reporting and can create an alert when it is close to expiry.
- An overdue audit finding appears in audit reports and may also increase overdue issue indicators if remediation is tracked as an issue.
12. Data Quality Checklist
Administrators should review these items before using reports for management decisions:
- Assessments have correct status, owner, dates, and control responses.
- Control statuses are supported by evidence.
- Risks have current residual likelihood, residual impact, owner, treatment, and review date.
- Issues and findings have due dates, assigned owners, and realistic status.
- Policies are published only when approved and ready for acknowledgement.
- Policy exceptions have expiry dates and business justification.
- Vendors and assets have owners and criticality values.
- KPI thresholds match the current risk appetite and management reporting needs.
- Scheduled report recipients are current and authorized to receive the content.
13. Related Pages
| Related Page | Why It Matters |
|---|---|
| Compliance and Assessments | Assessment scores, snapshots, evidence status, and non-compliance drive compliance reporting. |
| Risk Management | Risk scores, appetite breaches, treatment progress, owners, and reassessment flags drive risk reporting. |
| Governance | Policy reviews, acknowledgements, exceptions, and approvals feed governance reporting. |
| Operations | Issues, actions, incidents, findings, and overdue work feed operational health reporting. |
| Third Parties and Assets | Vendor risk, asset criticality, ownership, and review dates feed exposure reporting. |
| Data Quality and Governance | Use this when a KPI looks wrong because source fields, owners, statuses, or dates are incomplete. |
| Report and KPI Assumptions | Use this before presenting reports to explain calculation assumptions. |
14. Before You Start, Reporting Impact, and Common Mistakes
Before using reports for management decisions, confirm source data owners, reporting period, filters, KPI thresholds, audience, export permissions, and whether the report is draft analysis or a formal management pack.
Records that change reports and KPIs:
| Record or Field | Reporting Impact |
|---|---|
| Source module status fields | Drive open, completed, overdue, cancelled, and closed counts. |
| Owner and department fields | Drive accountability and organizational reporting. |
| Due dates and review dates | Drive overdue work and upcoming review reports. |
| Risk residual score and appetite policy | Drive critical risk and appetite reporting. |
| Assessment control status and applicability | Drive compliance score and trend reporting. |
| KPI threshold definitions | Change whether a KPI is green, at risk, or critical. |
Common mistakes:
- Sharing a report without confirming filters and reporting period.
- Fixing report numbers manually instead of correcting source records.
- Scheduling reports without a named owner and review cadence.
- Comparing periods after changing assessment scope, risk scale, or KPI thresholds without explanation.
- Sending exports to users who should not receive the underlying detail.
Use this module page when training report owners on filtering, exporting, KPI review, scheduled reports, and management pack preparation. Screenshots and operating guidance should stay with the module rather than a separate screenshot menu.
15. Screenshots
Dashboard
KPIs